INTRODUCTION
As the country divides in choosing its path to prosperity, school systems play critical roles that do not leave anyone behind, According to the Department of Education (DOE): “Education can only fulfill its promise as the great equalizer—a force that can overcome differences in privilege and background— when we work to ensure that students are in school every day and receive the supports they need to learn and thrive. At the same time, we know that many students experience tremendous adversity in their lives—including poverty, health challenges, community violence, and difficult family circumstances—that make it difficult for them to take advantage of the opportunity to learn at school” (DOE 2013).
LITERATURE REVIEW
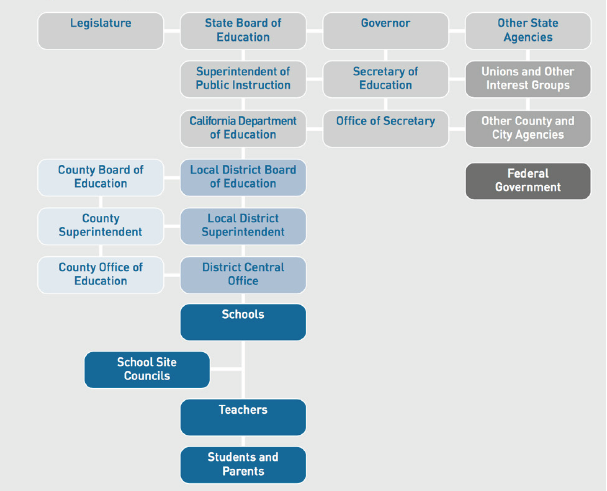
Figure 1: California Educational Governance System (UC Davis).
Network Experts in Social Sciences of Education and Training (NESSE) define governance by stating that it “is concerned with how the funding, provision, ownership and regulation of education and training systems is coordinated, and at what level; local, regional, national and supranational.” (NESSE). California’s governance is an intense and complex system that deals with schools; school districts; and county, state, and federal agencies.
METHODOLOGY
Phase 1
Analyze and discuss the Governance put forward in California and San Juan Unified School District (SJUSD). This information was obtained through researchers at UC Davis, and the SJUSD governance handbook, by providing an insight as to how policies are placed, and in which order positions in educational governance play a role in importance in school districts in California.
Phase 2
This phase will provide analysis on why there is spatial injustice in communities, like SJUSD. The history of a neighborhood that utilizes 4 out of the 9 high schools in SJUSD will be considered to determine any potential trends. In my evidence, I will be using Arden-Arcade’s Community Plan from 1980 to explore the history of an area that supports four of the nine high schools in SJUSD, such as Encina HS, Rio Americano HS, Mira Loma HS, and El Camino HS.
Phase 3
In the final phase, I will provide suggestions for preventing spatial injustice in low-income communities and providing an equal playing field for all students. Peer reviews and other programs that have been done across the country will be explored as possible solutions for reversing the trend of spatial injustice.
EXPLORING SPATIAL JUSTICE IN SJUSD
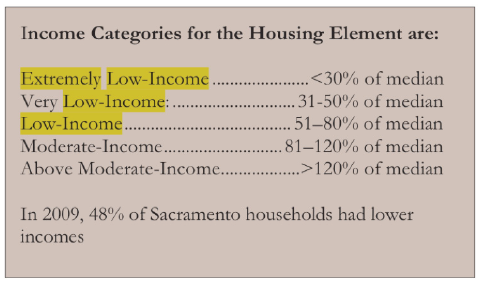
Figure 2: Income Categories for the Housing Element in Comparison to the Median Income (Sacramento General Plan, 2012).
In 2015, Sacramento County’s median household income was roughly $62,813 (U.S. Census). According to the U.S. Census, extremely low income families are earning less than about 30% of the median income, and very low income families are earning about 50% or less (Sacramento General Plan, 2012). Figure 2 below illustrates the housing element in Sacramento County.
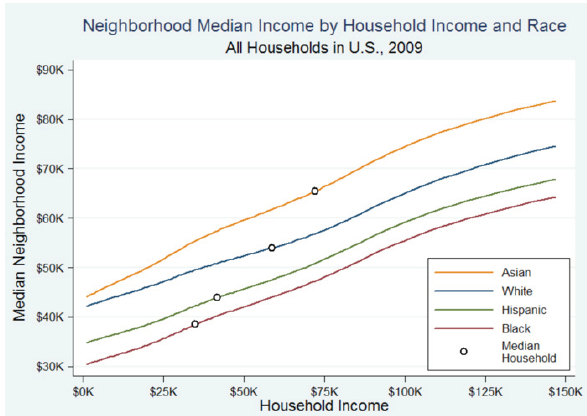
Figure 6: Neighborhood Median by Household Income and Race (Reardon, 2011).
Household incomes and neighborhoods correlate, due to a culture where money plays a vital role in individual achievement. For example, if a family was earning a VLI then the neighborhood the family lived in would correlate with the success of the parents, because their median income determines the housing they can afford. Figure 6 below illustrates this idea, each household income fits the mold of the neighborhood income.
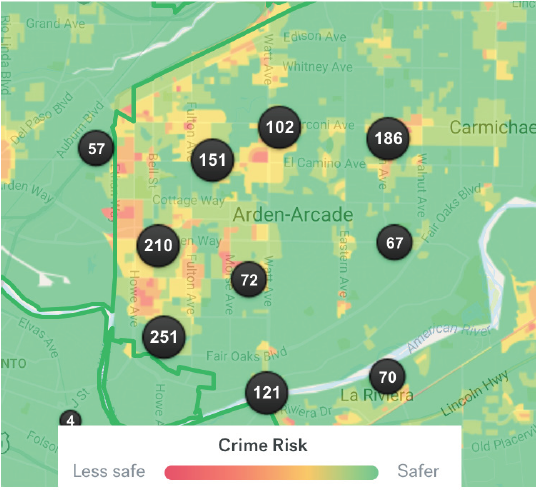
Figure 8: Crime Rates in Encina Boundary (Trulia, 2017).
Encina high school is just another statistic that is disadvantaged and has high rates of crime. Figure 8 below provides an illustration of the crimes that have occurred in Encina’s shool boundary. A large discrepancy exists between the amount of crime in the Encina High School boundary versus the Rio Americano boundary.
FACTORS TO SPATIAL INJUSTICE IN SJUSD
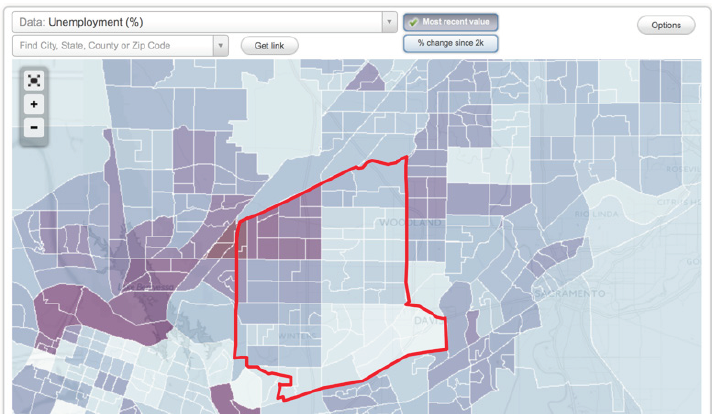
Figure 14: Arden-Arcade Unemployment Rate (City-Data, 2017).
Close to 90% of Arden-Arcade was Caucasian, but if you look at the demographics now from the 2010 US Census, 64,688 (70.2%) White, 8,977 (9.7%) African-American, 17,147 (18.6%) Hispanic, 7,420 (8.0%) Other Races. Whites have lost a population of roughly 13,000 in 30 years, and it has been taken notice to encourage code enforcement of the community plan to cause for more single-family homes in the heart of Encina high school boundary, El Camino avenue.
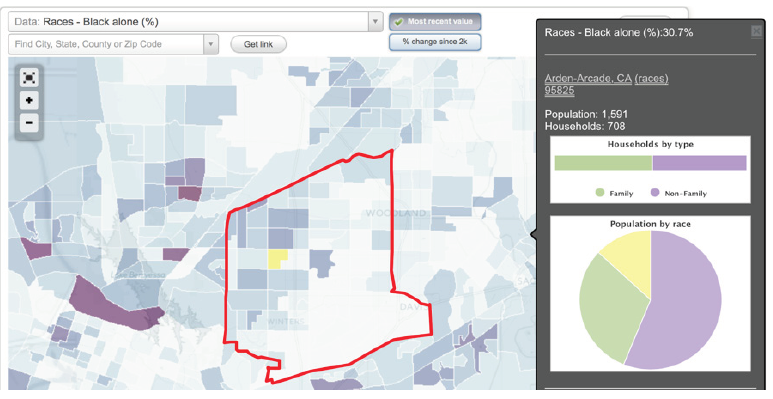
Figure 15: Arden-Arcade Races – Black alone (%) (City-Data, 2017).
It is difficult to say gentrification was unintended, but given the severity of how its taking shape in the rest of the County, it would make sense that Arden-Arcade is following suit. According to Yuqing Pan, writer for Realtor.com, his suggests that Sacramento is considered to be the 7th fast growing gentrification County in the U.S., he states, “Thanks to decades of urban redevelopment and to its affordable real estate, Sacramento—just a couple of hours east of San Francisco—is seeing an influx of young professionals and well-off empty-nesters” (Pan, 2017).
DISCUSSION AND CONCLUSION
My decision to choose SJUSD as a case study stems from my family history in the area as well as the experience of specific family members who have attended high schools in the district. Both my mother and cousin attended Encina High School, however both have significantly different experiences. My mother, who graduated Encina in 1979, described her experience as pleasant and calm. However, this experience is opposite to that of my cousin Tania, who graduated from Encina in 2009. She described her experience as very tumultuous and stressful.
In a recent conversation, she described once being attacked by a gang member after class, and reported weekly fights between rival gangs. She also described the school as rampant with drug use and promiscuity. In response to Tania’s experience, her parents decided on sending her younger brother Faraz to Rio Americano. The polarity between my mother and cousin’s individual experiences at the same high school testifies to how the issue in discussion has increased over the years. I also drew inspiration from my experience as a GIS/Planning Intern at the San Juan Unified School District office. The work I performed fostered a curiosity not only with how school district boundaries are formed, but also how they affect the ability of certain populations to enroll in specific schools.
Drawing from this experience helped me ask whether spatial injustice exists within the current education system and whether one’s geographical location was a determinant in their access to better schools. In forming my methodology in Phase 1, I first analyzed and discussed a variety of factors that play into the experience of individual students. I found that socioeconomic status (SES) plays a significant role not only in the development of the individual, but in their access to quality education. Keeping factors such as race/ethnicity and income level in mind, block tract data revealed that socioeconomic status correlated directly to access to quality schools.
Source: Cal Poly
Authors: Nima Kabirinassab