BACKGROUND AND CONTEXT
The City of Oakland’s population exploded after residents migrated from San Francisco following the Great Quake of 1906. Previously, most of Oakland’s development had occurred along its waterfront and was related to the port which responded to the needs of the shipping industry. After the earthquake, however, the city size grew to 60 square miles and the population doubled to 150,000. The physical character of the city then changed to include boulevards, picturesque parks, other civic improvements, and connectivity to surrounding cities. Foreign immigrants were drawn to Oakland for these reasons and as a result, Chinatown was created adding to the city’s diversity.
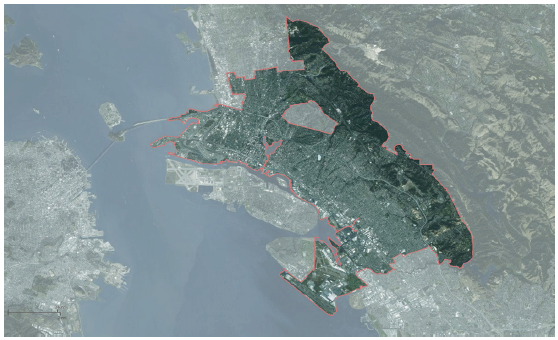
map of Oakland with city limits.
The intersection of King and Story was originally considered the city of East San Jose. In 1911, East San Jose was annexed into San Jose’s city limits and King/ Story became a neighborhood. In 1930, much of Eastern San Jose consisted of rural agricultural lands. During this time Cesar Chavez and his family became residents of the Alum Rock neighborhood which borders the King/ Story neighborhood.
Cow Hollow is a subset of the greater Marina District that originally consisted of sand dunes, freshwater springs, and grassy meadows. The neighborhood was considered “the country” and wealthy San Franciscans would occasionally build mansions sparsely throughout the area. It wasn’t until the very end of the 19th century that Cow Hollow began to receive large scale residential development.
The population of African American residents in San Jose is small when compared to San Francisco or Oakland due various reasons such as the city’s age and settlement patterns. Nonetheless, Downtown San Jose contains the largest residential population of African Americans in San Jose at 5.1%.
RESEARCH AND ANALYSIS
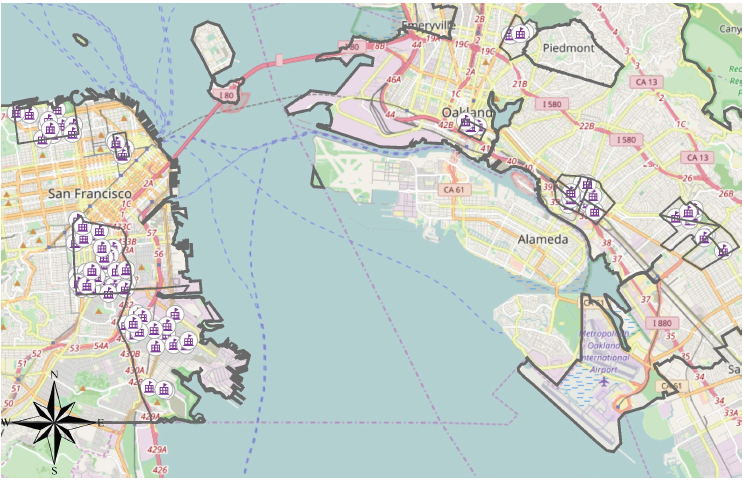
Map of schools in San Francisco and Oakland by neighborhood.
Educational institutions such as primary schools, secondary schools, and higher education institutions are positive features for neighborhoods. Often, families will live in a particular neighborhood specifically for its school district. According to a national study conducted by Realtor.com (2016), higher ranked school districts are 49% more expensive on average than the national median list price and 77% more expensive than homes found within lower-ranked districts.
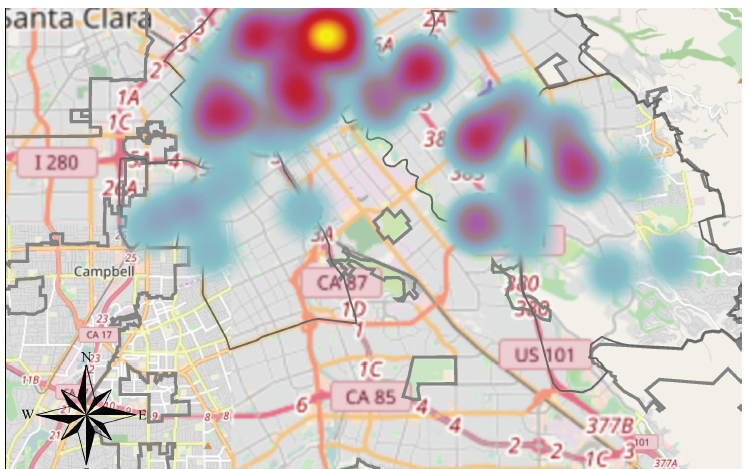
Heat map of grocery stores in San Jose Map.
Neighborhood grocery stores provide residents with the convenience of desired goods within a walkable distance from their homes. The value of having attractive food options such as a Trader Joes, Safeway, or Albertsons in close proximity increases home value. Matthew Bomberg of UC Berkeley found residential property values in Oakland would increase by $22,000 for homes within a half-mile and $30,000 for homes within a quarter-mile of supermarkets (Bomberg, 2012).
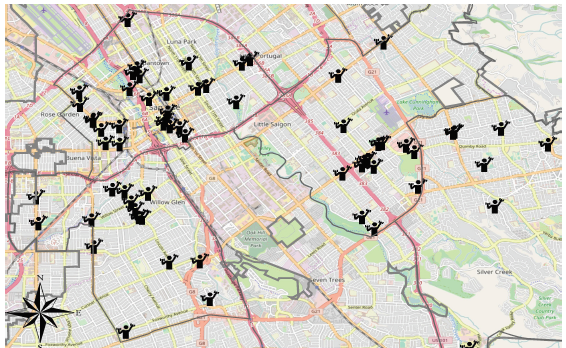
Map of Fitness and Recreational Sports Centers in San Jose.
Fitness and sports centers are beneficial to neighborhoods because they provide equipment to improve residents’ health through exercise. Examples of such facilities include gyms, training centers, health spas, and recreation centers. A study by Johnson Gardner (2007) found fitness centers in Portland Oregon increased home values by 8.1% while close proximity to spas decreased home values by 6.3%.
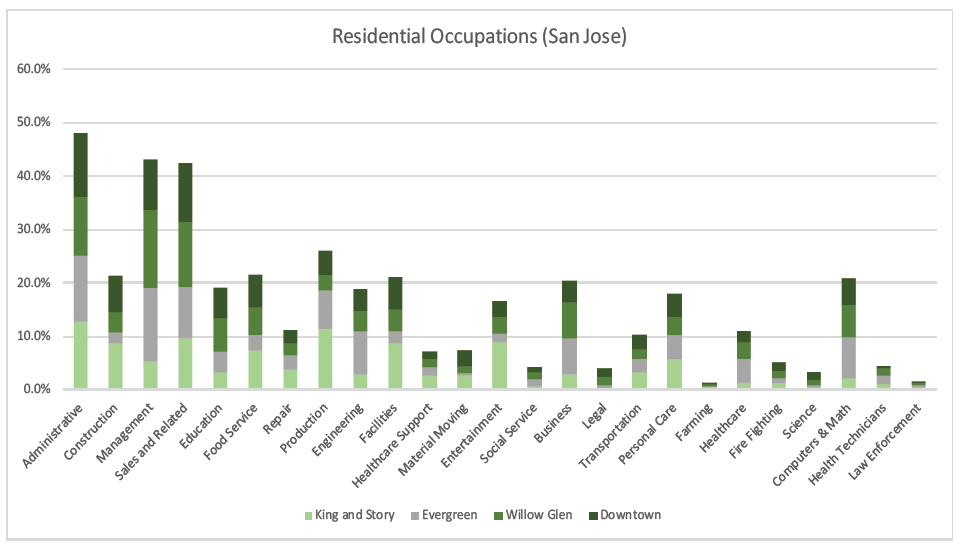
Figure 3: Occupations by industry in San Jose.
The combined median income of Hispanic neighborhoods was $66,966 whereas the total in Black neighborhoods was $52,800. By contrast, Evergreen residents work throughout the greater San Jose area and receive higher incomes from larger employers. Black and Hispanic communities both contained their highest residential populations in administrative occupations (Figure 3), but differed in combined median incomes.
SUMMARY AND CONCLUSION
This analysis has covered many attributes related to the relationship of race, walkability and its impacts on home value. While each section of the report has a distinct influence, there is no definitive answer that can be given with regards to what particular attribute influences home value the most. However, certain attributes are more significant in their impact on home values. For example, neighborhoods with opening or expanding museums could receive increases from 20% to 50% while proximity to poor quality parks decrease value by 14%.
Determining the value of a neighborhood is a very complex process, this research has revealed the following; crime was expected to be a huge deterrent in the walkability of neighborhoods and an even larger deterrent in home value. However, the results were inconclusive with regards to walkability but accurate in terms of the effects to home values. Amenities also yielded varying results as proximity to hospitals decreased home values by 3% while proximity to religious institutions increased home value between 0.3% and 6.27%.
At times, the amenity types were also representative of the racial composition in neighborhoods. Communities of color had higher shares of liquor stores and check cashing stores as opposed to high ranking educational facilities and banks. Some amenities proved to be consistent regardless of neighborhood; every community featured at least one library and two fitness centers representing a positive correlation in home value for those features. Active transportation was an important determinant in home value because communities that featured alternative infrastructure command up to $34,000 more in home value.
But, if a neighborhood had poor quality infrastructure, home values did not improve. Factors such as income and occupation, environmental influences and gentrification illustrated how race affects home values. The social impacts of these demonstrated significance as communities of color were more susceptible to experience greater inequality. Variations in the benefit to home value that were found in the setteled neighborhoods represents the complexity of the relationship findings and reflect the overall characteristics of the multiple factors that influence neighborhood value.
Source: California Polytechnic State University
Authors: Jonathan Turner